How to review VPS resource usage statistics?
Management and monitoring is the crucial part of the administrator, which they often do for the VPS to avoid unwanted resource abuse or attack. This article will demonstrate how you can review the VPS usage statistics.
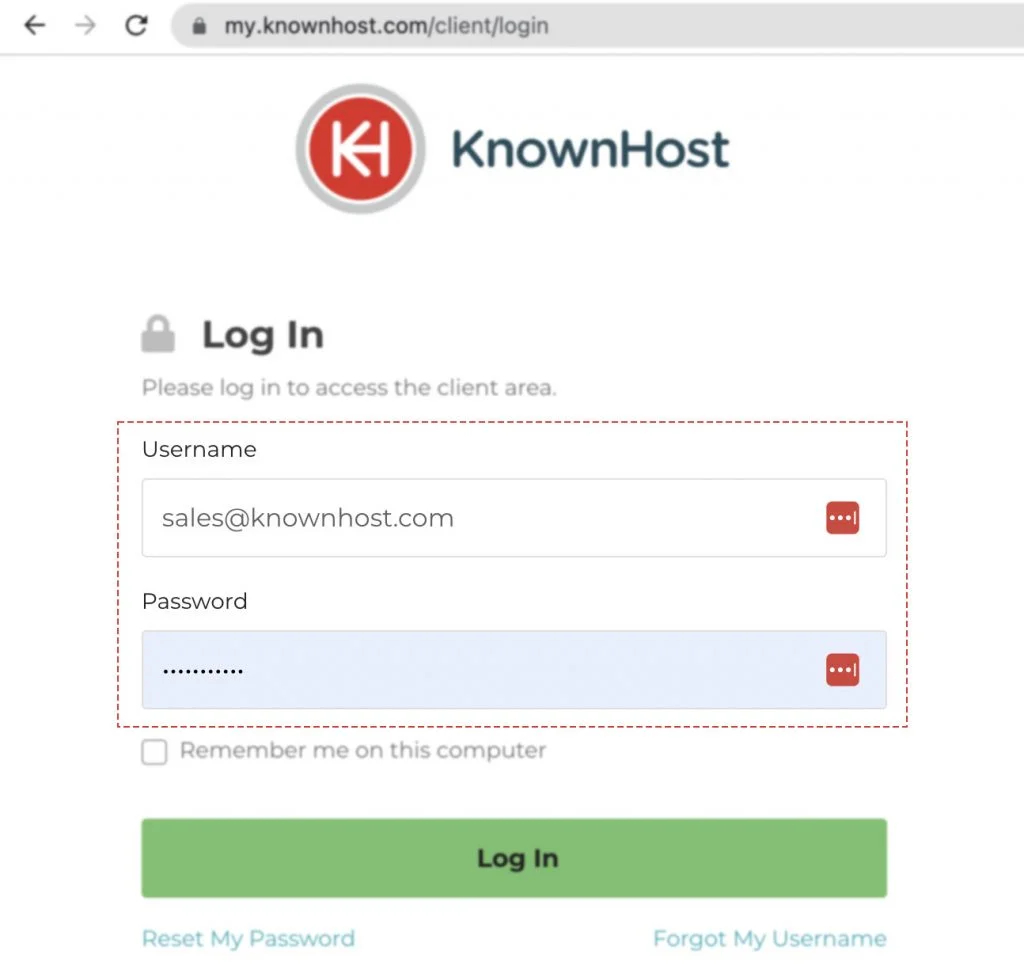
1. First, login into Billing Portal (my.knownhost.com) with registered email address and password.
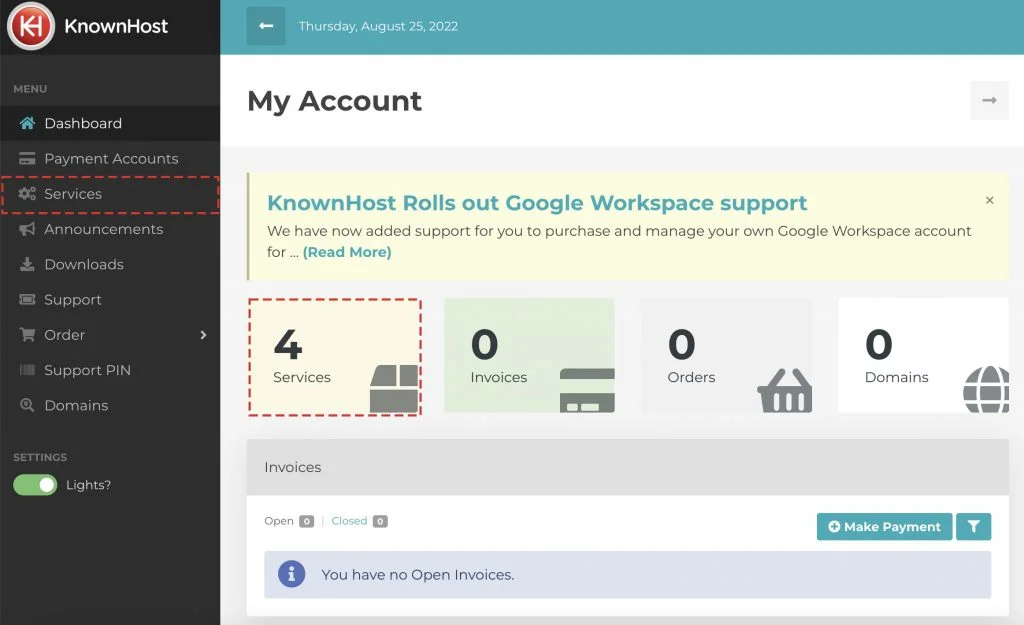
2. In the Navigation tray, you can find the option “Services” click on that or you can navigate to Dashboard → Click on Services.
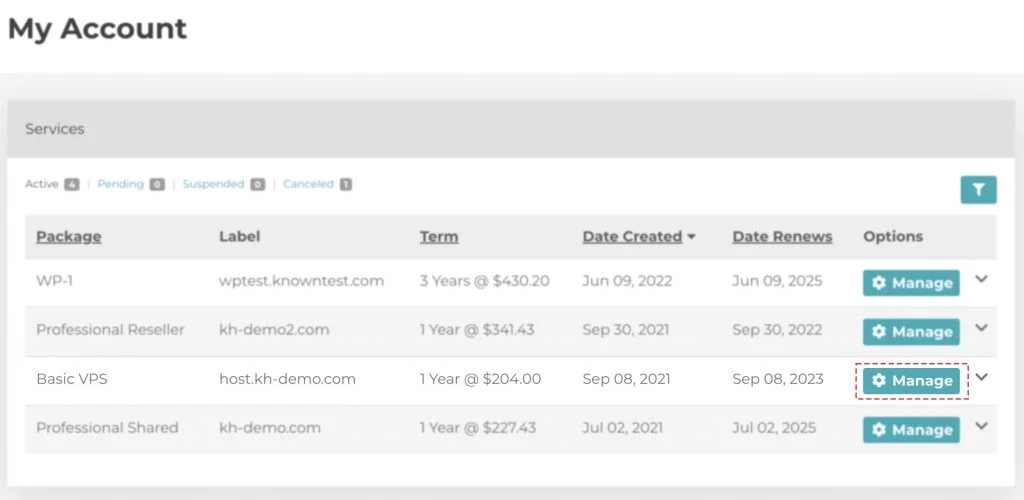
3. Locate the VPS → Click on Manage.
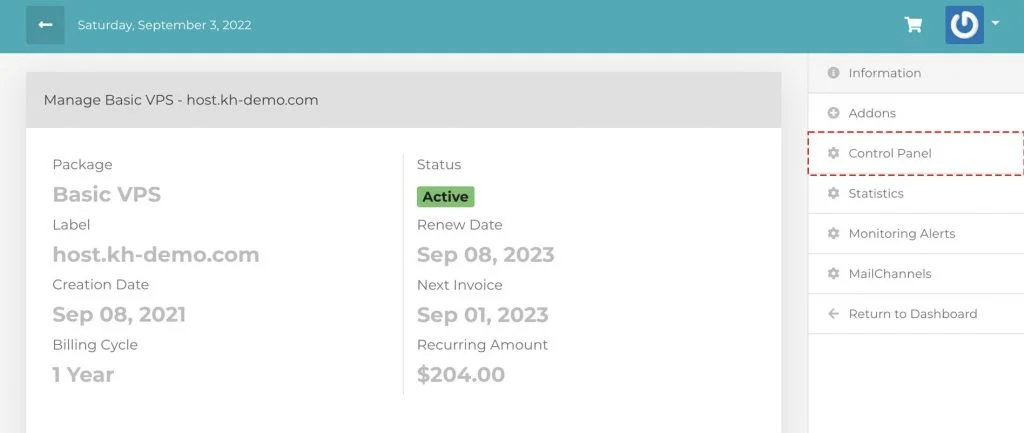
4. Navigate to Control Panel.
3. Scroll down a bit, navigate to Graphs.
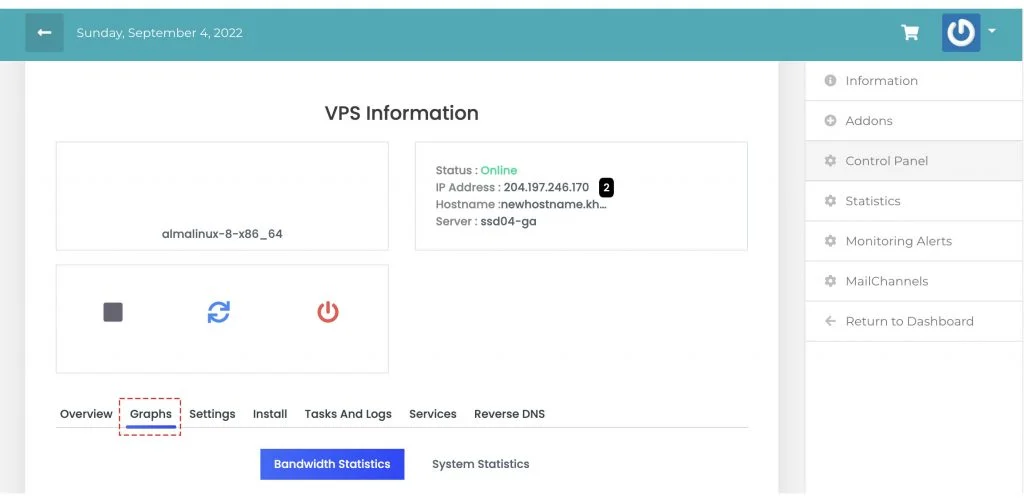
4. Here, we can monitor two types of resources,
Bandwidth Statistics
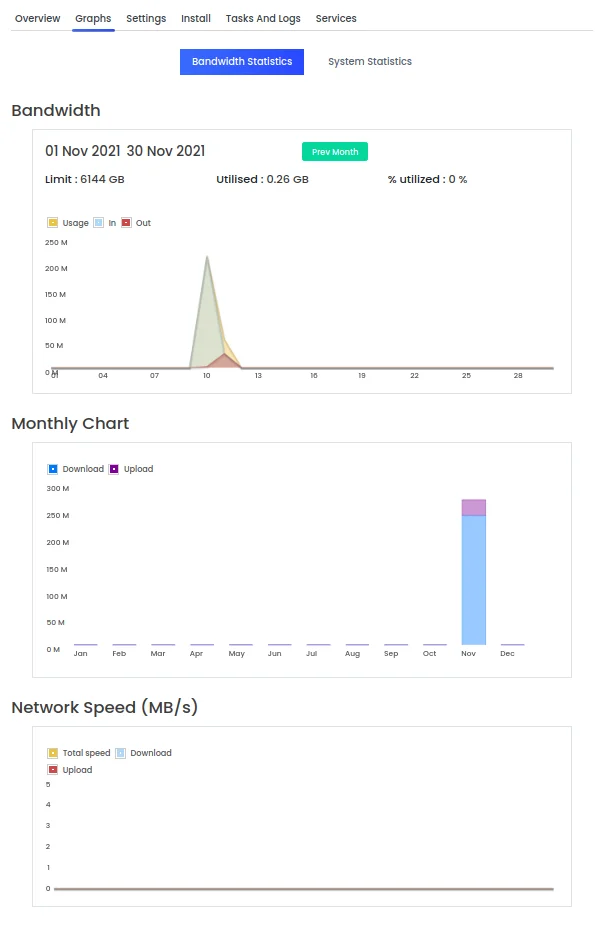
The bandwidth statistics section provides you with three graphs to chart the usage of bandwidth within the virtual server.
- Bandwidth: Provides a thirty day usage showing your current limit, utilization and percentage while providing a graph that charts the usage.
- Monthly Chart: Provides a per-month graph showing the overall Download and Upload for each month.
- Network Speed: Provides a current graph of the present network usage being utilized at the time of viewing.
System Statistics
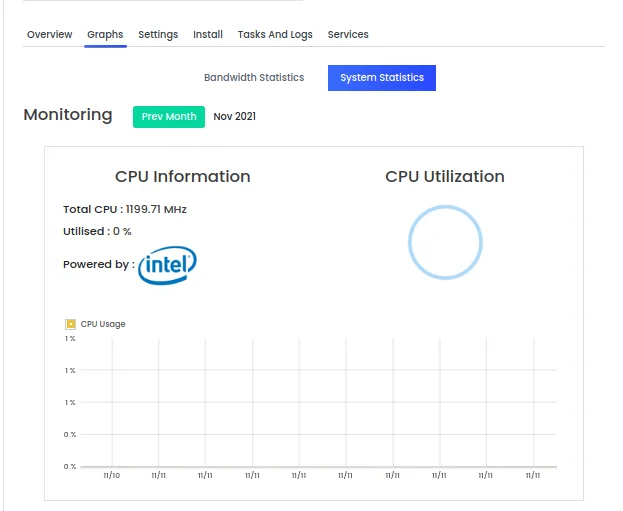
The system statistics information provides a more in-depth view of what the VPS has done for the current month. If previous months data exists, it can be reviewed.
The following graphs are available
- CPU Info & Utilization: This shows the current allocated CPU and its usage overtime.
- RAM Info & Utilization: This shows the current RAM allocation and its usage overtime. This number may be higher then what you expect as it takes into account cached memory, which will count as overall used memory
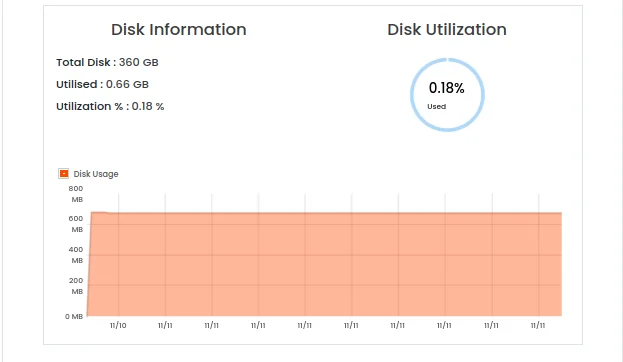
- Disk Info & Utilization: This shows current disk usage overtime, useful for tracking if you’re experiencing sudden disk consumption at a higher rate then usual.
- Inodes Info & Utilization: Provides the overall inodes able to be utilized within the server. A quick explanation of what an inode is basically that they’re files. One file is one inode.
- I/O Information: Provides historical usage of I/O Read and Write speeds. Can help understand if you’re hitting bottlenecks of experiencing unnecessary I/O behavior. Examples being MySQL causing high I/O, but you want to verify.
- Network Information: Provides histoical usage of the download, upload and total speeds while providing averages of network traffic.
Below you will find images in a slideshow of what each graph looks like and what it provides.
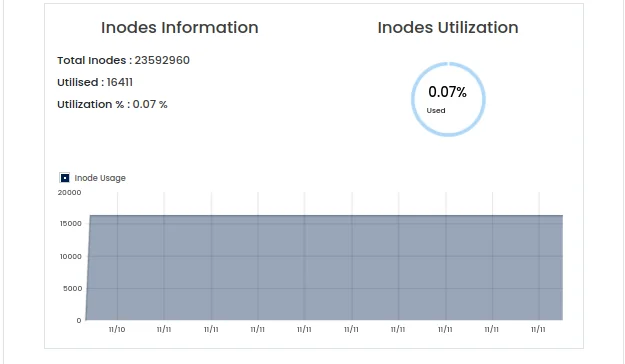
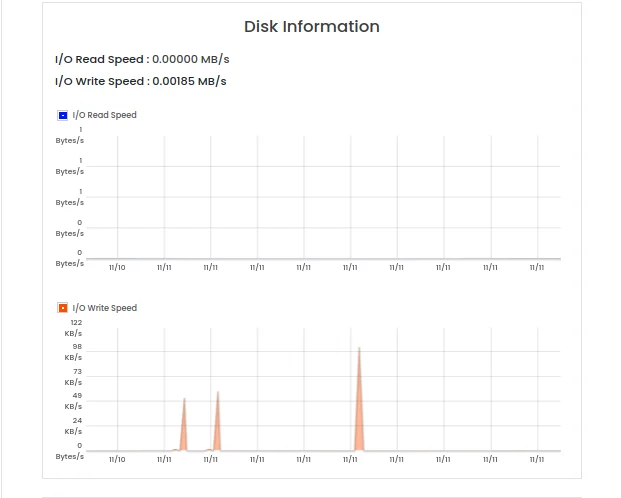
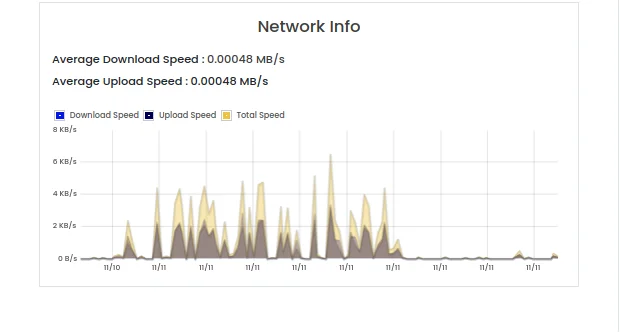
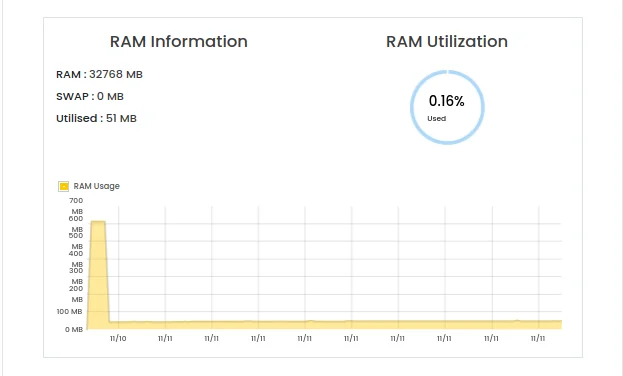
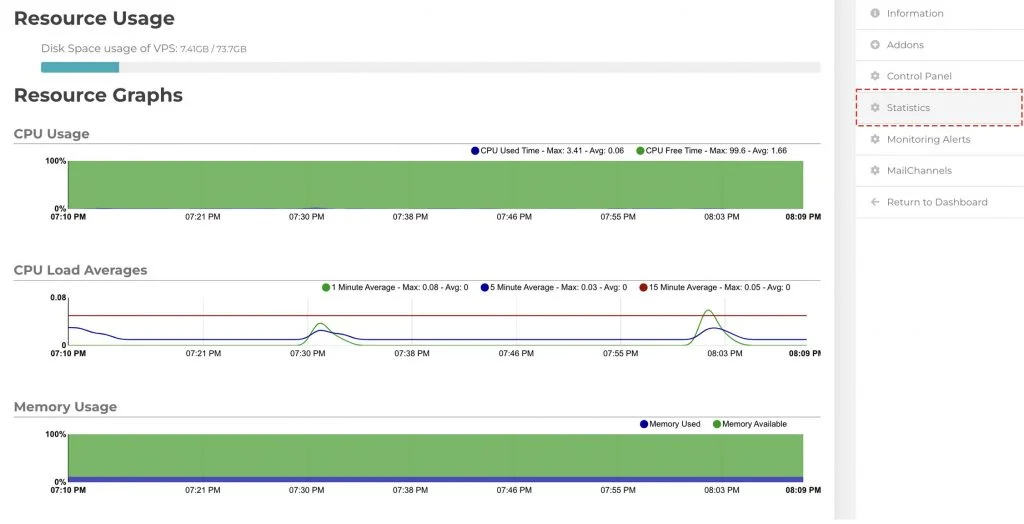
Furthermore, you can monitor the selective CPU Usage, CPU Load Averages, Memory Usage from Statistics tab.
Conclusion
Now that we’ve gone over it, how to review/monitor VPS resource usage. This practical feature is specially designed for administrators and users to monitor their VPS’s real-time usage from one place.
KnownHost offers 365 days a year, 24 hours a day, all 7 days of the week best in class technical support. A dedicated team ready to help you with requests should you need our assistance. You’re not using KnownHost for the best webhosting experience? Well, why not? Check with our Sales team to see what can KnownHost do for you in improving your webhosting experience.