States Most Impacted by Data Center Pollution
Data centers are a hot topic for rapidly growing enterprises, with the number increasing consistently whilst attempting to match the demand of businesses requiring cloud and IT facilities.
A data center is a building or dedicated space that hosts a set of networked computer servers that have a variety of uses, such as remote storage, processing and supplying data.They take a considerable amount of energy to operate, whilst also consuming large amounts of water to help cool servers and maintain the conditioned temperature. Furthermore, they create electronic and toxic waste which can increase the likelihood of releasing toxic substances, which can further damage the environment.
These repercussions have led to the focus on companies adapting their business needs and objectives to lessen data center usage or provide solutions to counteract their harmful results.
With all this in mind, we at KnownHost have conducted a study to examine the effect of data centers and their estimated production of carbon dioxide, taking into account the different types of data centers and the variations in their carbon intensity.
Which State’s Data Centers Produce the Most Carbon Dioxide?
To discover which US state’s data centers produce the highest levels of carbon dioxide, we’ve calculated their estimated carbon dioxide equivalent (CO2-eq) using the Siddik & Sehab (2021) estimations of the carbon intensity of different data center types. This data was gathered based on each state’s total number of the three main types of data centers including internal, colocation and hyperscale. Different data centers operate at different levels of carbon intensity – internal data centers are the most carbon intensive , while colocation centers are the least carbon intensive.
Each state’s total number of data centers can be found here. Using this information in conjunction with the above calculation, we can find an estimation for which state’s data centers produce the most carbon dioxide equivalent:
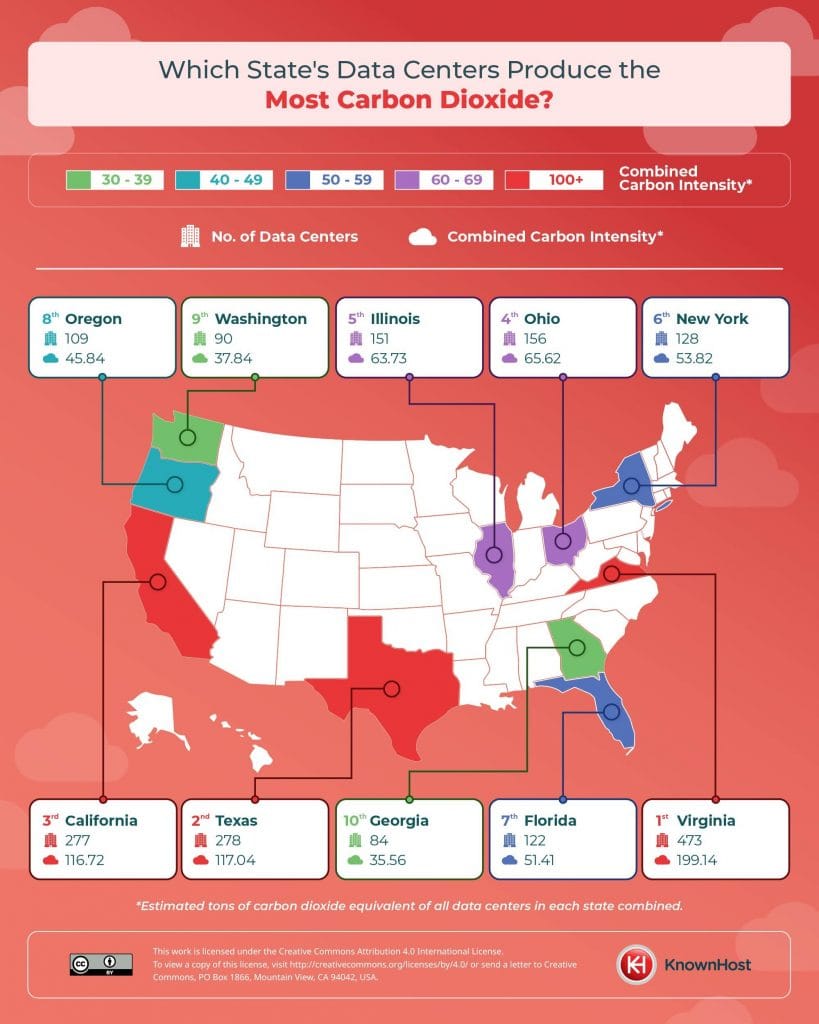
Virginia holds the top spot with the highest carbon intensity, at an estimated total of 199.1 tons CO2-eq. This amount is over one seventh of the entire estimated amount of CO2-eq produced by US data centers. Virginia is a hub for technology due to its reliable power supply, low costs and network infrastructure.
The second highest producer is Texas with 71.25 tons CO2-eq across a total of 278 data centers, closely followed by California with 116.7 tons. Next is Ohio which, relatively speaking, drops significantly with production at 65.6 tons. Illinois is in fifth with 151 data centers producing 63.7 tons of CO2-eq.
Which State’s Data Centers Produce the Least Carbon Dioxide?
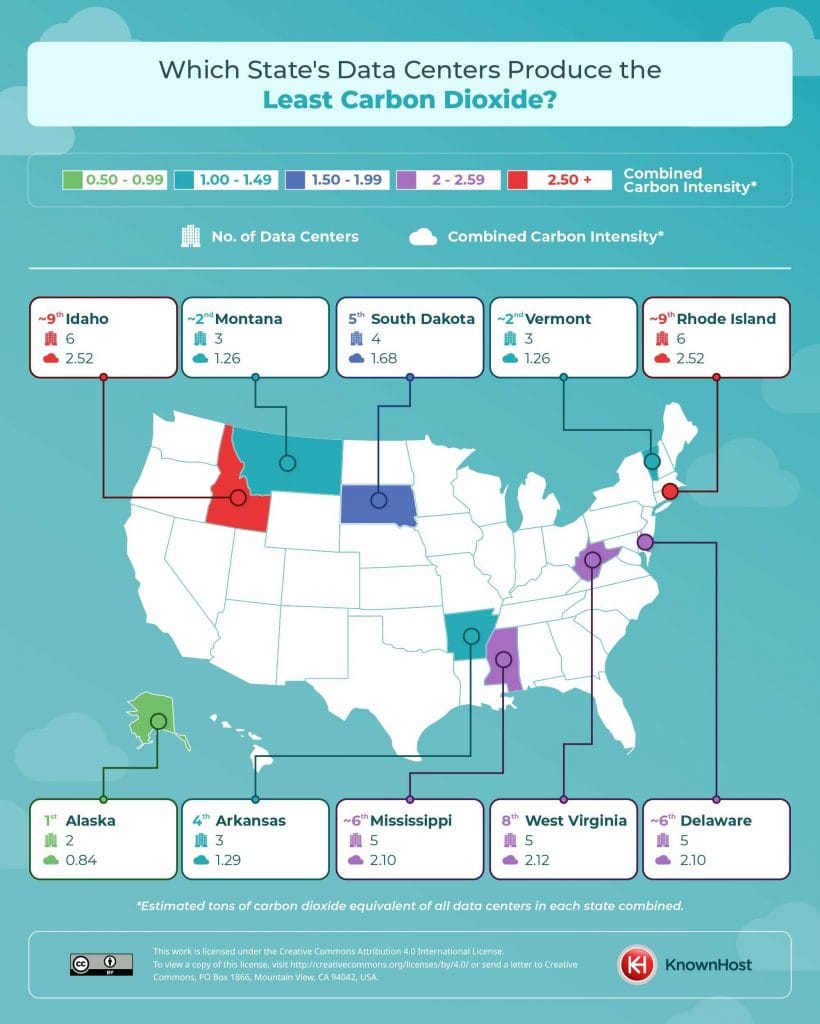
The smallest estimated amount of CO2-eq is produced in Alaska, where only two colocation data centers are located at the time of the study, which combines to produce 0.8 tons of CO2-eq. This is then followed by joint states Vermont and Montana which each producing 1.3 tons of CO2-eq. As you’d expect, the minimal amount of CO2-eq in the states is primarily due to the fact that they have very few data centers at time of writing (all less than 10 each).
Conclusion
Web hosting pollution is a concern across the U.S. due to the significant production of greenhouse gases and the number of natural resources it requires. There has been a growing interest in preventing this impact by turning to renewable energy to assist in the operational capabilities of data centers. This is still an ongoing study, but the potential of this transition is important in helping to reduce our negative effects on the environment. Due to the inevitability of data hosting expanding as technology advances, discovering eco-friendly solutions to pollution is a necessary objective.
Methodology
Data Center Map was used to collate the total number of data centers in each US state, after which we calculated their total number of each data center type by site searching the different states. We used to Siddik & Sehab (2021)’s calculation of each data center type’s carbon intensity to work out the estimated tons of carbon dioxide equivalent of all the data centers in each state. This allowed us to find out which state’s data centers generate the most carbon dioxide and rank them accordingly.
If you’d like to view the full state-by-state ranking, click here.
Virginia, Texas, California Top CO2 Chart - Data Center News
October 10, 2024 at 12:59 pm[…] study from webhosting supplier KnownHost examined the carbon dioxide equal (CO2-eq) emissions per […]